18,000 intraoral photographs,
annotated at pixel level
Expert segmentation for dental AI: six clinical classes, six standardised views per patient, drawn from a clinical pipeline in production.
- Tooth
- Gum
- Tartar
- Cavity
- Gingivitis
- Restoration
intraoral photographs
unique patients
polygon instances
480 images across 80 patients, published under approved access — masks, COCO export and data card included.
What the dataset is
A curated collection of intraoral photographs carrying pixel-level polygon annotations, produced by Dr Romain Lateur, dental surgeon, and drawn from a clinical pipeline running in dental practices today.
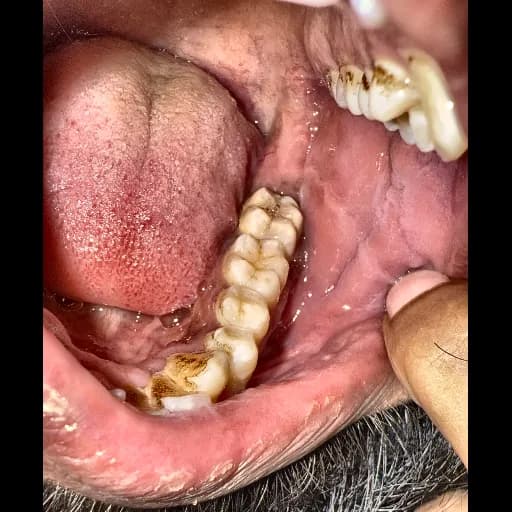
Built for semantic segmentation: a model learns to identify and localise oral structures and pathologies directly on standard dental photographs — not radiographs.
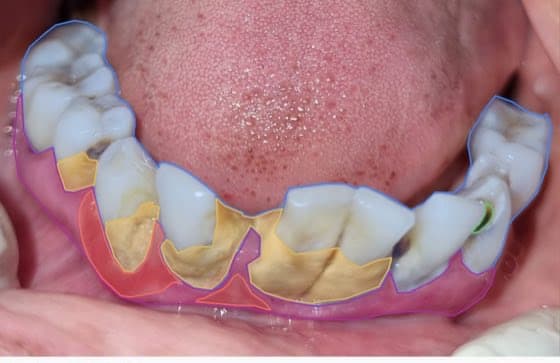
Example opposite: P2310, upper arch, tartar.
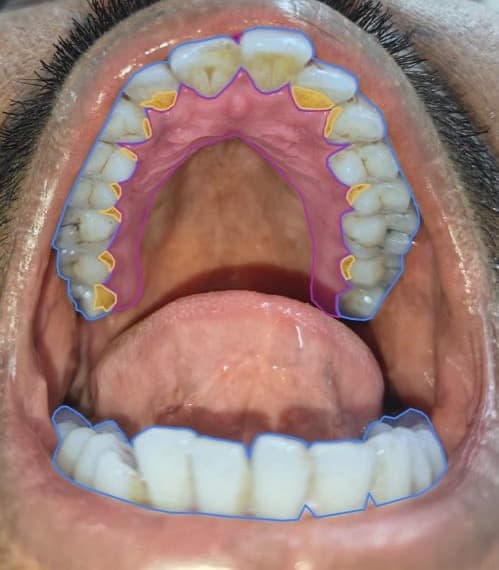
Six clinical classes, anatomy and pathology
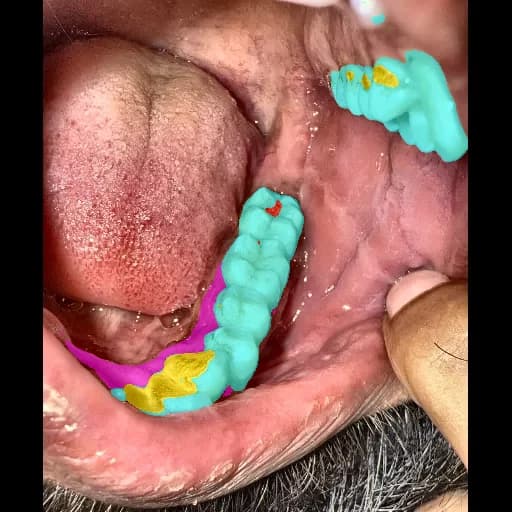
Colours match the exported mask channels and the on-image legend exactly.
Tooth
toothVisible enamel surface — the most frequent class by pixel area.
Gum
gumSoft gingival tissue around the teeth. Colour varies across individuals.
Tartar
tartarHardened plaque deposits — small, irregular, periodontally relevant.
Cavity
cavityDecayed tooth regions. Darker, structurally irregular, often subtle.
Gingivitis
gingivitisGum inflammation: redness and swelling, recognised by texture and colour.
Restoration
restorationCrowns and restorative material — distinct colour and reflectivity.
Six standardised views per patient
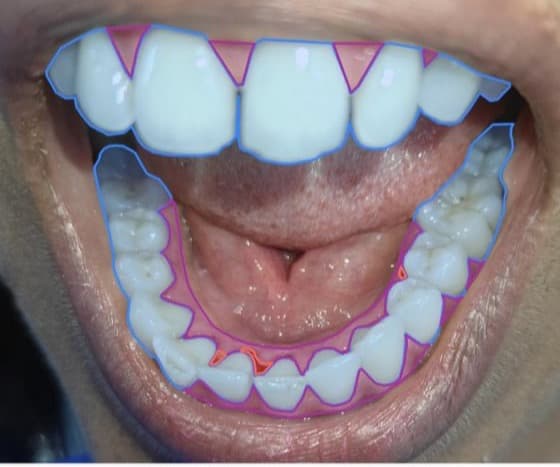
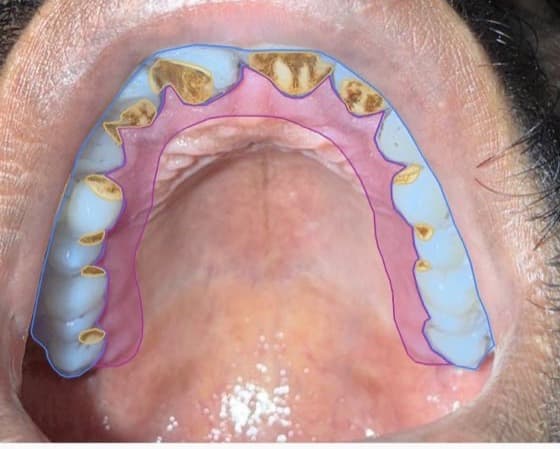
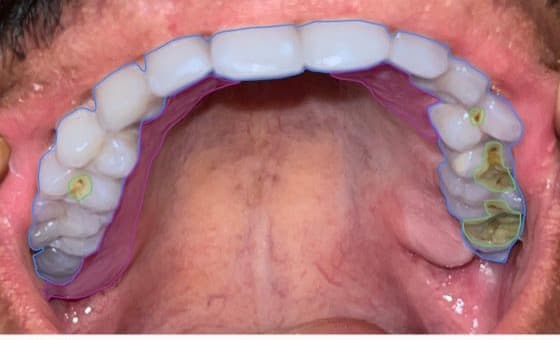
One complete patient (P2389), the six-view series in capture order. Every patient is photographed through the same six positions, in the same order — so view, arch and sextant are always known, never inferred.
- 1
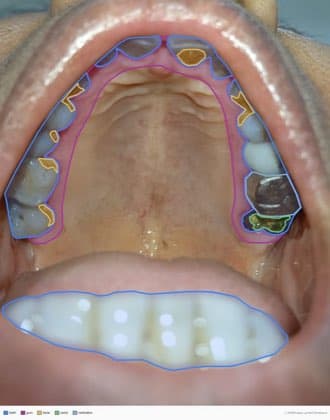
upper_center
- 2
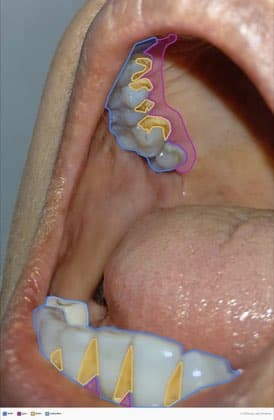
upper_right
- 3
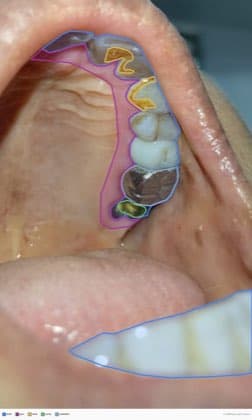
upper_left
- 4
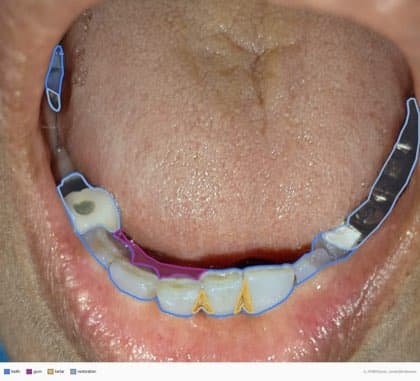
lower_center
- 5
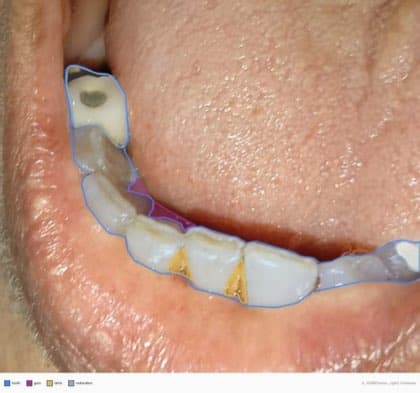
lower_right
- 6
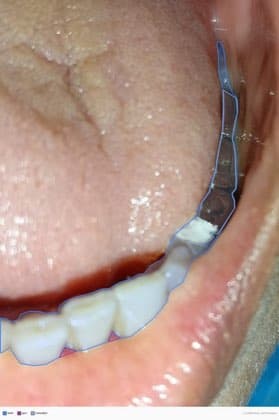
lower_left
Multi-class semantic segmentation
Closed polygons, not bounding boxes — the true boundary of every lesion is traced.
- annotation type
- Closed polygons (2D coordinate sequences)
- storage
- One JSON file per image, plus a standard COCO export
- masks
- Multi-channel binary, shape (6, H, W) — one channel per class
- overlap
- Separate channel per class: overlapping findings are preserved (tartar on tooth)
- localisation
- Every finding is tied to the tooth, the gum, or the tooth-gum junction
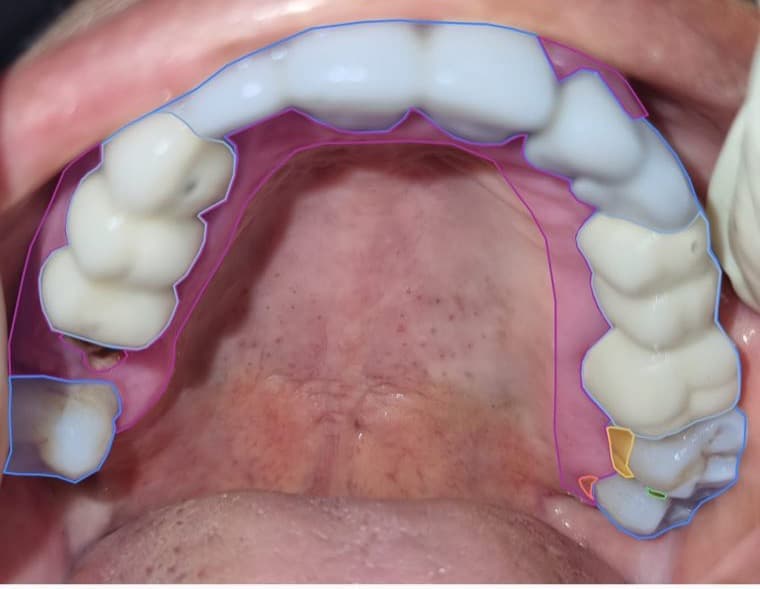
Photograph, polygons and legend — delivered together
Every image in the dataset ships with its polygons and its legend, in the same export.
What 18,000 images really contain
Two anatomical classes in almost every frame, four pathologies at their real-world prevalence. Nothing is rebalanced or resampled: this is the imbalance a model meets in practice.
| Class | Instances | Images | Patients | Per positive image |
|---|---|---|---|---|
| Toothanatomical base | 30.3 % | ~100 % | 100 % | 2.1 |
| Gumanatomical base | 41.3 % | ~98 % | 100 % | 2.9 |
| Tartarpathology | 19.6 % | ~33 % | ~54 % | 4.0 |
| Cavitypathology | 6.4 % | ~25 % | ~49 % | 1.8 |
| Gingivitispathology | 0.9 % | ~5 % | ~14 % | 1.4 |
| Restorationpathology | 1.4 % | ~6 % | ~12 % | 1.5 |
100,000+ annotated instances · roughly six per image. Class presence is indexed frame by frame: class-enriched subsets can be assembled on request. Collection continues under the same six-view protocol and grows every week.
Four deep-learning models, trained on this dataset
Every photo is read by five models voting pixel by pixel: only the areas where they converge are flagged. Tartar, cavity, inflamed gum — each area comes back with a probability score, in a visual language the patient understands immediately.
- Tooth
- Gum
- Tartar
- Cavity
- Gingivitis
Evaluate the dataset
The sample published on Hugging Face shows exactly the delivered format: 480 images across 80 patients, with annotations, masks and COCO export. The full corpus follows, under agreement.
Dr Romain Lateur · MouthCare — NT Corporation · contact@mouthcare.fr · +33 6 35 16 19 23
Access to the full dataset is agreement-based. Sample images are downloadable only after the evaluation terms are accepted, and no image is sent by e-mail.